Visitor
to Order
Conversion
Company
Xometry
Type
Feature Update, A/B Test
Role
Lead Product Designer
Tools
Sketch, Confluence, Amplitude, Split
- 7–10% of visitors click on the main call to action “get a quote”
- 33% of those visitors actually end up getting a quote, leading to a combined conversion rate of ~2%
Finding Solution
To drive incremental revenue, I worked with other stakeholders to prioritize running an AB test in our visitors-to-quoter-to-customer funnel.
First up, we focused on an experiment to test improvements to the capabilities pages that serve as entry points for our paid search customer acquisition funnel.
The Experiment
The user journey from finding Xometry to placing the first order is a long funnel, with many opportunities for users to fall off during the process. We wanted to highlight the ease of use of our quoting platform to reduce the visitor drop-off early in the funnel.
Control Treatment (Off)
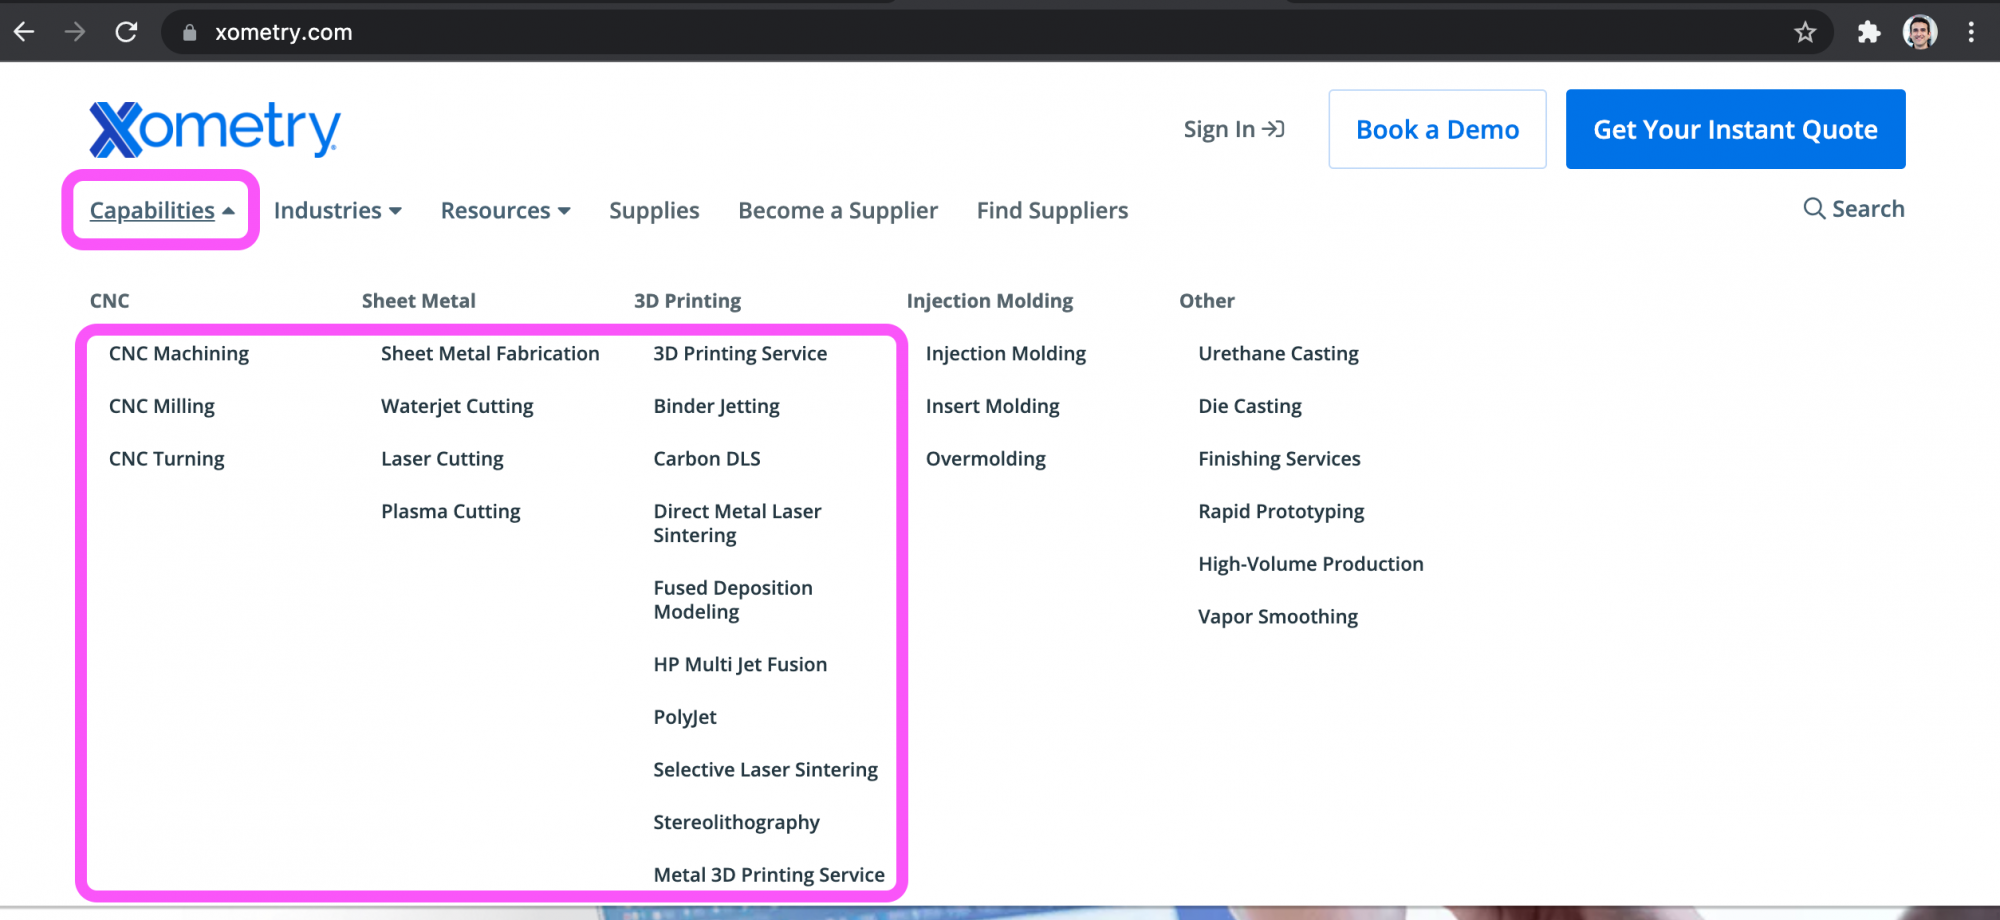
The existing process capabilities pages had a clean, simple design. Yet, visitors to Xometry’s capabilities pages didn’t get a sense of the instant quote user experience unless they clicked on a CTA, and as a result, a vast majority of the visitors dropped off before clicking on a CTA.
Anytime we make big changes to our visitor funnel, there are significant risks in disrupting our revenue and user experience. In order to make improvements with confidence, I needed the ability to reliably run an A/B test experiment.
There are three foundational pieces to the way we run experiments and collect data. The first step in creating the experiment is managing it with split.io.
Split
The Split platform allows me to control the A/B test experiment in a variety of ways. This platform allows me to assign feature flags to randomized user groups, cohorts, in order to measure the effects of our changes on conversion rates across all our metrics.
Segment
The backbone of our data management systems is Segment: a robust system for event delivery. Segment allows us to connect a wide variety of data sources and data destinations together. In this case, I am using Split as a source of data being sent into Amplitude, which is then merged with our other data sources in Amplitude, such as tracking events that tell us when users perform specific actions on our website
Amplitude
In order to measure all of these results, I used Amplitude to analyze our data and build charts and reports to visualize the results. This allows me to connect data from a variety of sources to display a rich story about the journeys that our users experienced. By creating a framework of powerful tools, and implementing them in compact, reusable components I have created a methodology for running reliable, repeatable experiments in the future.
Success Metrics
My primary metric for measuring the success of this experiment was capabilities pages CTA Clicked conversion and my secondary metric was the Quote Started conversion metric. While my ultimate goal is visitors placing their first order, this metric is a lagging indicator and we decided to focus on the earlier targets in the funnel.
Result
I ran the experiment for a minimum of 2 weeks and concluded it once we reached statistical significance above a 97.5% chance to outperform on both the primary and secondary success metrics.
CTA Clicked, Success!
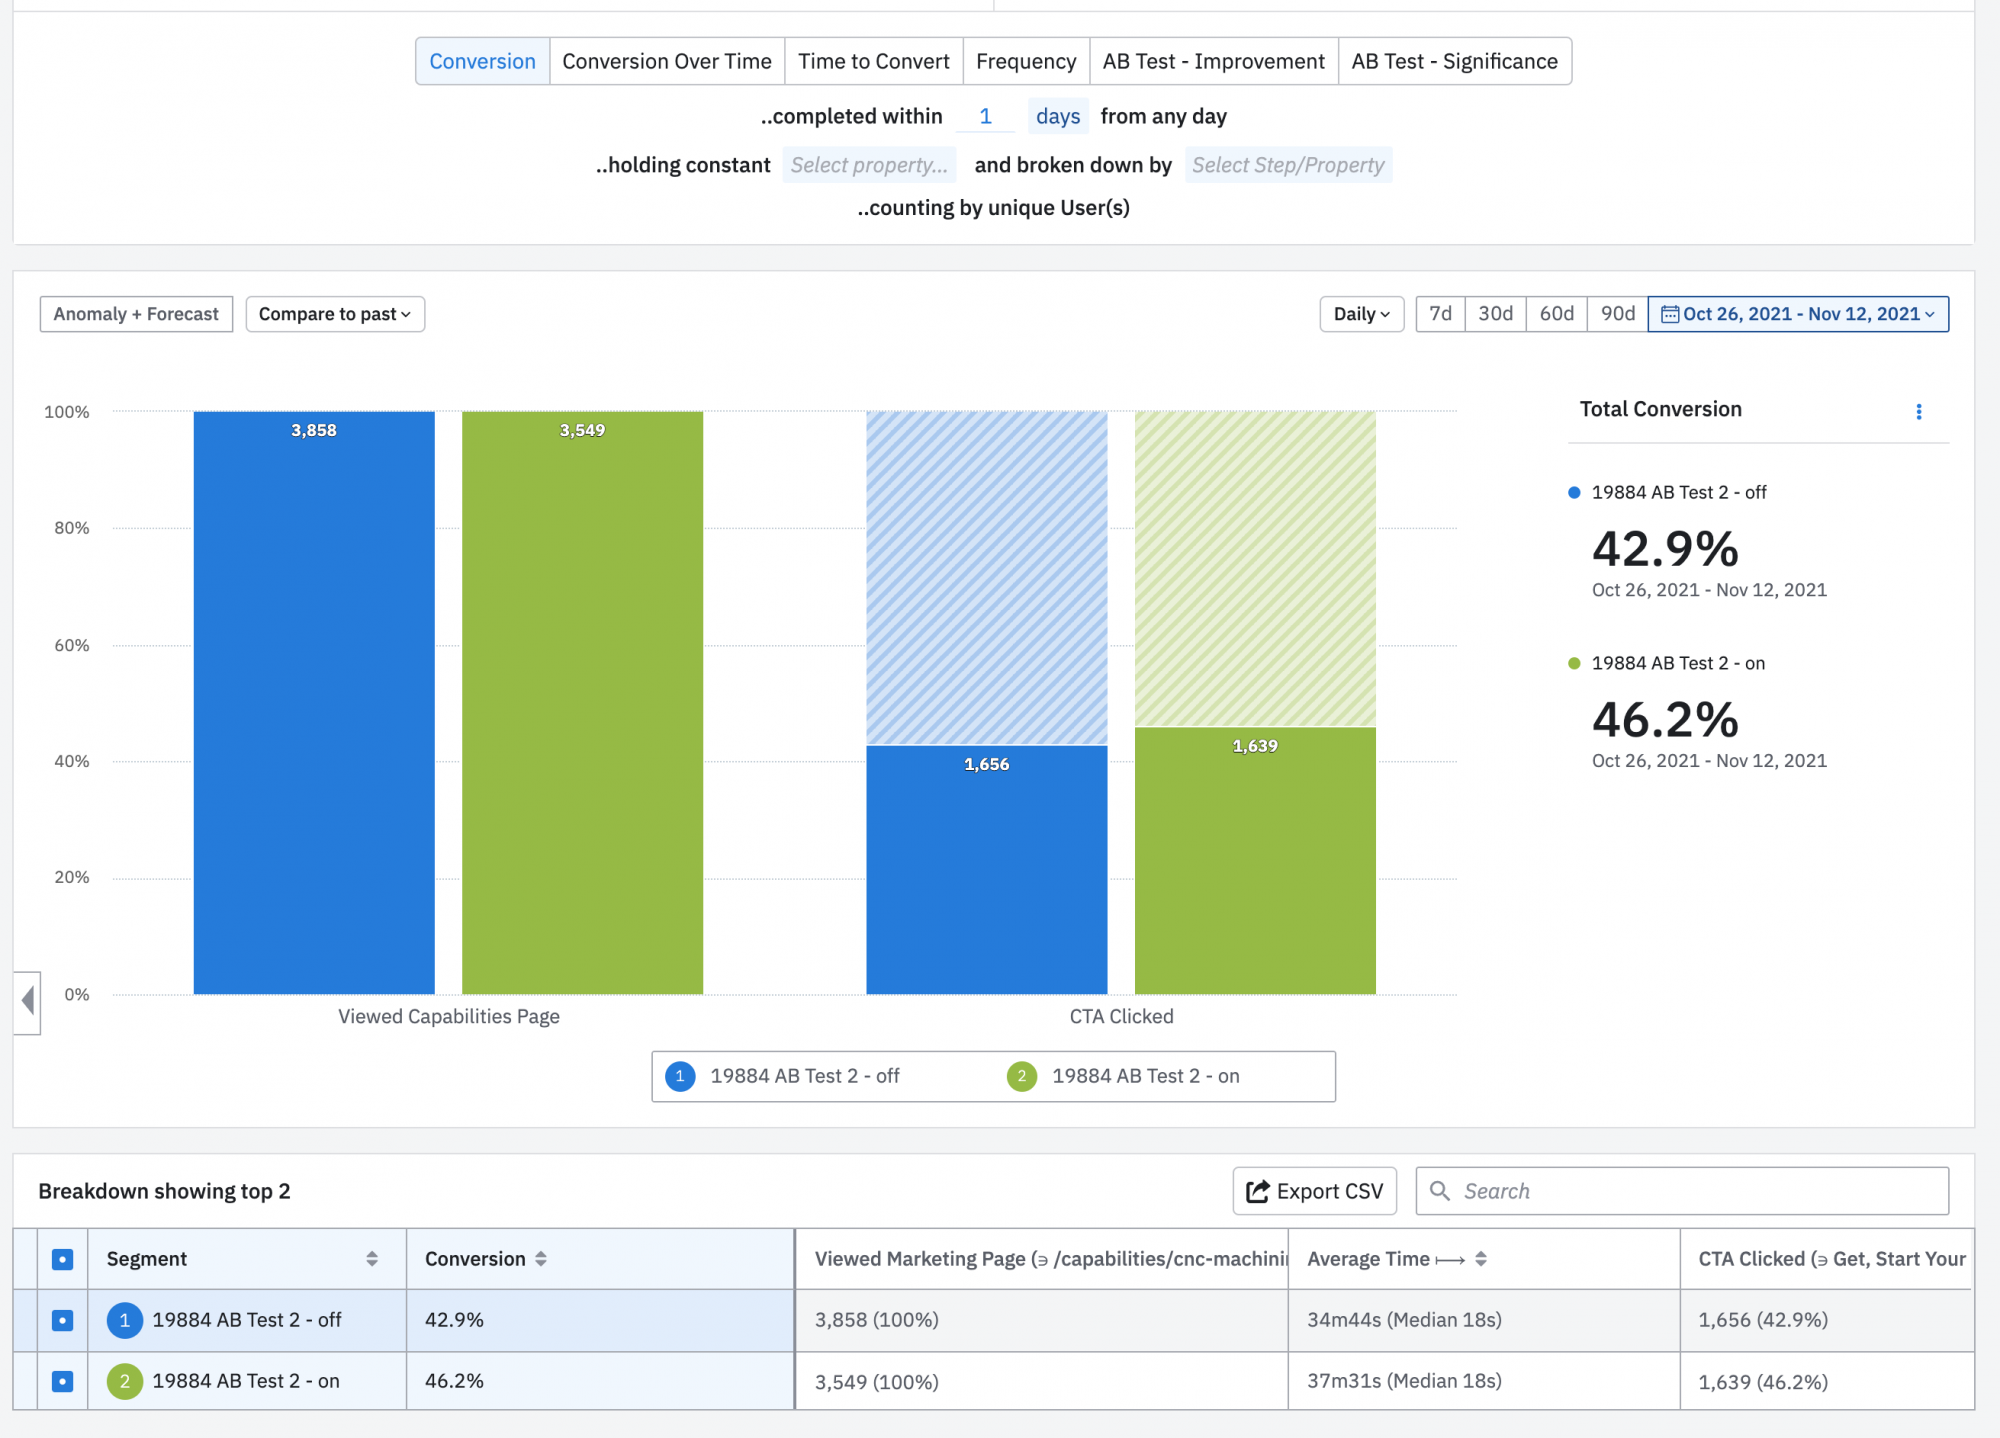
The test treatment resulted in a 7.59% CTA Clicked Improvement Over Baseline (46.2% vs 42.9%), and a 99.8% chance to outperform, exceeding our 97.5% threshold for statistical significance.
By examining the CTA Clicked metric, I was able to see this statistically-valid increase in the percentage of visitors to the capabilities pages that clicked on a “Get Your Instant Quote” or “Start a New Instant Quote” CTA anywhere on the marketing pages within a visit.
So, did the higher CTA Clicked conversion result in a higher Quote Started conversion?
Quote Started, Success!
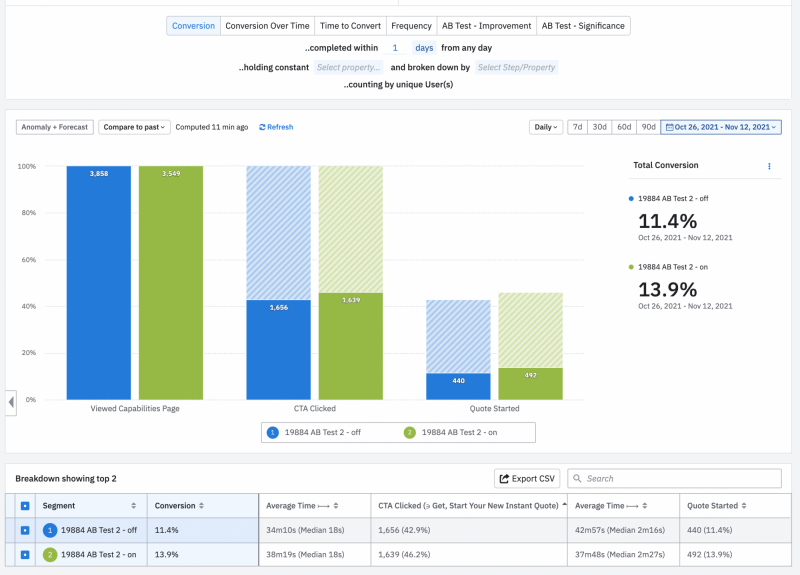
The test treatment exceeded my expectations and resulted in a significantly higher 21.6% improvement in visitor-to-quote-started conversion over baseline (13.9% vs 11.4%), and a 99.9% chance to outperform exceeding our 97.5% threshold for statistical significance.
By examining the Quote Started metric, I was able to see this statistically-valid increase in the percentage of visitors to the capabilities pages that made it through the anonymous quoter flow and created a quote.
Summary
The chart of all the experimental results is summarized and shown below.

Recommendations
Based on the results, I recommended setting the new capabilities page as the new standard design and setting the Split to100% for all users.
A small percentage of visitors don’t receive the Split assignment, so we’ll also update the code to make the changes permanent, remove the Split code, and extend the new design to other manual-quote capabilities pages, including Injection Molding.
We are eager to continue improving our quoting experience from end to end. Within the capabilities pages, future experiments will include the ability to start an anonymous quote by uploading 3D files directly from the marketing pages.
One of the great selling points of Xometry is the depth and breadth of the manufacturing capabilities offered, but this can be confusing and overwhelming for users who are not familiar with all of the options available. By providing more customized context and learning tools around each of our capabilities pages, we hope to educate and retain more users within the quoting funnel.


